


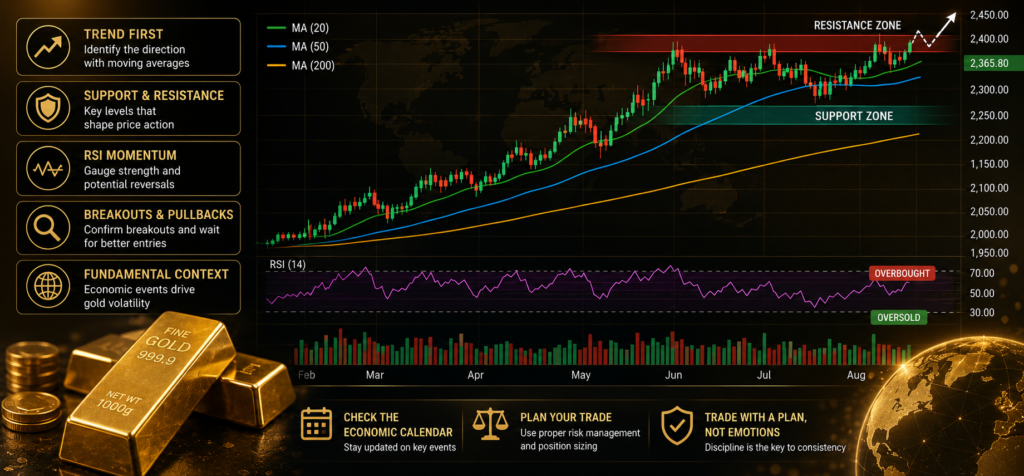
Gold prices can move quickly, but the daily chart often tells a calmer story. This helps traders step back from short-term noise and see the broader trend, important price levels and possible entry points. This matters especially if you’re using CFDs to trade gold. Leverage can magnify both potential gains and losses, so entering a trade based on a clear setup is far better than chasing every price move. This is where gold technical analysis can help.
The daily chart does not predict the future. Instead, it gives you a structured way to assess what the market is doing now and what could happen next.
What is Gold Technical Analysis?
Gold technical analysis involves studying historical price and volume data to identify potential market patterns and trends. Traders use indicators, like moving averages, support and resistance, trendlines, Relative Strength Index and Fibonacci levels, to make gold price forecasts.
To understand the value of analysis, consider how the precious metal touched 53 new all-time highs in 2025, while total gold demand exceeded 5,000 tonnes for the first time. The yellow metal also returned more than 60% during the year.
That kind of rally can create strong momentum, but it can also produce sharp corrections. A daily chart can help you distinguish between a temporary pullback and a potential change in direction.
Start with the Trend
Use the daily chart to check if the price is in an uptrend or downtrend. Higher highs and higher lows usually indicate an uptrend, while lower highs and lower lows signal a downtrend. If neither pattern is clear, gold may be moving sideways.
Many traders use moving averages, like the 20-day, 50-day and 200-day moving average lines, to verify the trend. For example, if gold trades above its 50-day and 200-day averages, the broader trend is upwards.
Mark Support and Resistance
Support is an area where buying pressure has previously stopped or slowed a price decline, and resistance is where selling pressure has limited the price from rising higher. But be careful not to treat these as exact numbers. Gold can move through a level temporarily before reversing, especially during major economic announcements.
A better approach is to think in terms of zones. If gold approaches previous resistance and momentum starts weakening, traders usually wait for confirmation before opening a position. If price breaks above resistance and holds there, the former resistance level may become the new support. This simple shift can create a useful entry point.
Watch Momentum with the RSI
The Relative Strength Index (RSI) helps assess momentum. An RSI above 70 traditionally signals overbought conditions, while a reading below 30 indicates an oversold market. However, don’t automatically sell gold when RSI reaches 70 or buy when it falls below 30.
Strong trends can keep an asset overbought or oversold for longer than expected. So, look for confirmation. For example, if gold reaches a major resistance zone while RSI forms a lower high, the combination could suggest weakening momentum. That may be more useful than the RSI reading alone.
Look for Breakouts and Pullbacks
A breakout occurs when gold moves decisively beyond an established support or resistance area. But not every breakout is genuine. Prices can briefly cross a level before moving back into the previous range.
Traders often wait for the daily candle to close beyond the level and check if the price retests the level before considering an entry. For CFD traders, a breakout can offer an opportunity, but entering after an already extended move can also increase risk. Waiting for a pullback may provide a more controlled entry.
Combine Technical and Fundamental Analysis
Charts tell you what price is doing. Fundamental analysis can help explain why.
Gold prices are highly sensitive to interest-rate expectations, the US dollar, Treasury yields and geopolitical risk. Many analysts expect ongoing geopolitical tensions, investment demand and central bank buying to remain important factors for gold in 2026.
This is why experienced traders check the economic calendar before acting on a technical setup. A seemingly clean chart can change suddenly after US inflation, employment figures or a Federal Reserve decision is announced.
Use your gold technical and fundamental analysis to decide your stop-loss before entering the position. Also consider position size carefully. Leverage can make a relatively small price move have a much larger impact on your trading account.
What to Look for in a Platform Providing Gold Trading Insights
When choosing a platform, look for more than a simple buy or sell alert. Check whether it provides clear XAU/USD entry levels, stop-loss and take-profit guidance, technical and fundamental analysis, and timely alerts when market conditions change.
It is also worth checking whether the provider explains the reasoning behind the signals and publishes a transparent record of past performance. A gold price forecast is only a scenario, not a guarantee. Use forecasts alongside your own analysis and risk controls.
Final Thoughts
Daily-chart analysis does not need to be complicated. Start with the trend, mark the important price zones, check momentum and then look for confirmation. Add the fundamental picture before making a decision.
Gold had a strong run in 2025 but remains volatile in 2026. That’s why traders need both context and discipline. If you don’t have the time or expertise to use technical analysis, gold trading signals can help you identify entry and exit levels.
Risk Warning: Educational purposes only. No investment or financial advice. Trading CFDs involves significant risk. Please refer to the full disclaimer available on our website.