


Best Tools for Trading Gold
The price of gold had a very interesting 2026 with rapid swings keeping even experienced traders on their toes. The precious metal touched an all-time high of around $5,405/oz in January and fell to a seven-month low of about $3,974/oz in June. Despite the ongoing US-Iran conflict, the safe-haven asset was on a downtrend for four months before hitting this low. Interest-rate decisions by major central banks, inflation rates, geopolitical developments and economic uncertainties can all move gold prices.
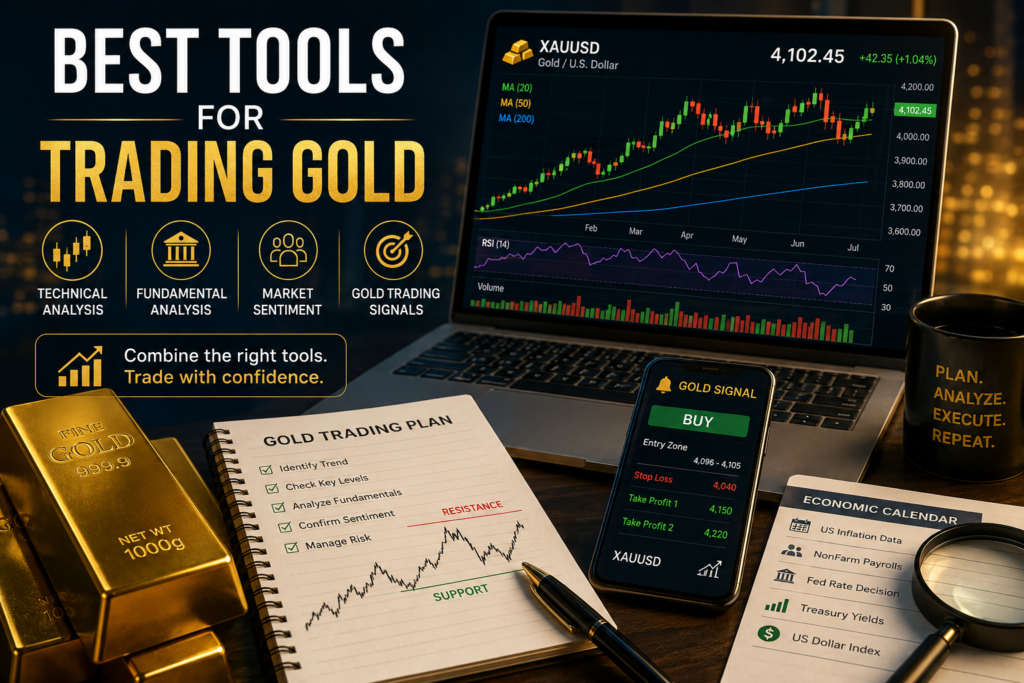
Wondering what the best tools are for trading gold in today’s market? No single indicator or platform can work the ‘best’ all the time. That’s why experienced traders typically combine technical and fundamental analysis with market sentiment data and free gold trading signals.
Technical Analysis
Technical indicators help you study price behaviour and identify potential entry and exit points. But you don’t need 10 different indicators on one chart. Too many might lead to confusion, while a few well-chosen tools can provide a clearer picture.
Moving Averages
The 20-day, 50-day and 200-day moving averages can help identify the broader trend. If the price is above a rising 50-day moving average, it could signal bullish medium-term sentiment, while a move below it can signal weakening buying momentum. The 200-day average is useful for identifying the longer-term direction.
Relative Strength Index
RSI measures momentum on a scale from 0 to 100. Readings above 70 traditionally indicate overbought conditions, while readings below 30 indicate oversold conditions. But remember not to treat these levels as automatic buy or sell signals. Gold can remain overbought during a strong rally. Instead, use RSI alongside price levels and the broader trend.
Support and Resistance
Mark areas where gold price has repeatedly reversed or paused after moving up (resistance) or moving down (support). If price approaches resistance and momentum weakens, you can wait for confirmation before entering a long position. A clean break above resistance with high trading volume can give more confidence, particularly if price holds the level after the breakout.
Fundamental Analysis
While technical analysis shows what gold is doing, economic data helps explain why. The most important releases to monitor while trading gold include US inflation, employment data, Federal Reserve decisions, Treasury yields and the US dollar.
Interest rates are particularly important because gold doesn’t generate interest income. When investors expect rates and yields to rise, gold can face downward pressure, while expectations of lower rates can increase gold demand.
The US Federal Reserve (Fed) kept its federal funds target range at 3.50%-3.75% at its July 2026 meeting. Spot gold prices immediately jumped over 1% to exceed $4,100 per ounce. This is because markets had priced in a roughly 30% chance of a rate hike, leading to a relief rally supported by safe-haven demand due to the Middle East tensions.
US employment data, especially the US NonFarm Payroll (NFP) data, also matters because a stronger or weaker labour market can change expectations for Fed policy.
But you can’t rely only on one economic number. Compare the result with market expectations and watch how Treasury yields and the USD respond.
Market Sentiment
Gold often attracts investors when uncertainty rises. Geopolitical tensions, financial-market stress and concerns about economic growth can increase demand for the safe-haven asset. We saw this when investors added 801 tonnes to global gold ETF holdings in 2025, while central banks bought 863 tonnes.
But sentiment can change quickly due to news breaks or economic releases. So, if you see a bullish technical pattern, check whether broader risk appetite supports the trade. Watch equity-market volatility, bond yields, the US dollar and major geopolitical developments. They can all provide clues about whether investors are becoming more defensive or more willing to take risk.
Gold Trading Signals: Make Decisions Easier
Free gold trading signals can simplify the decision-making process. A useful signal typically provides an entry level or zone, a stop-loss, potential take-profit levels and an explanation of the setup. Some services also provide updates when market conditions change.
This can save you a lot of time and effort. Instead of scanning multiple charts and economic releases before every trade, you can start with a structured trade idea and then do your research to see if it works with your strategy.
However, remember that no signal can guarantee success. Use signals as decision-support tools, not as automatic instructions.
Build a Simple Gold Trading Toolkit
The best gold trading tools are the ones that help you make a decision with greater clarity. Gold technical analysis can identify trends and momentum. Economic data explains the forces behind price movements. Sentiment shows how investors are positioning, while free gold trading signals can bring these elements together into a more practical trade idea.
A good toolkit can also help you understand where to set stop loss and take profit levels to manage risk.