


As we enter 2026, Gold is no longer just a “safe haven”—it has become a strategic baseline asset. While traditional analysts are stuck looking at basic trendlines, our team at ForexGoldSignal has identified the institutional “Smart Money” footprints that suggest we are only in the middle innings of this historic bull run.
In this guide, we break down the 2026 Gold Forecast through the lens of institutional liquidity and central bank accumulation.
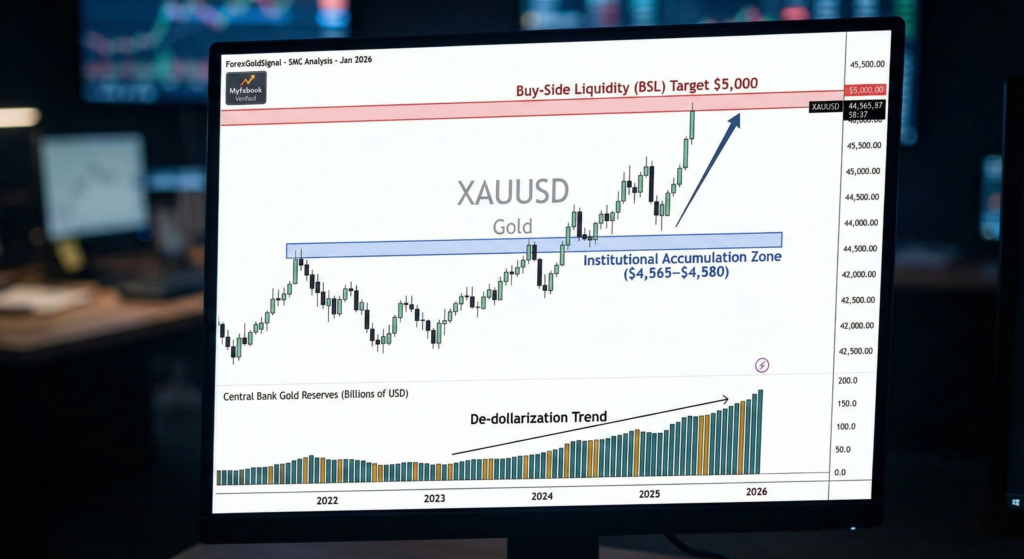
1. The 2026 Macro Catalyst: "Alt-Fiat" Dominance
The primary driver for 2026 isn’t just inflation; it’s De-dollarization 2.0.
Central Bank demand: According to recent 2026 data, central banks (led by BRICS+ nations) are now purchasing gold at 4x the pre-2022 rate.
The US Debt Factor: With global debt exceeding $346 trillion, the “opportunity cost” of holding Gold vs. USD has shifted. Gold is now being held as a primary reserve, surpassing the Euro in total central bank allocations.
2. Technical Analysis: The Smart Money Roadmap
We don’t just use “Support and Resistance”; we track Institutional Liquidity.
The Weekly View (High Timeframe)
Gold spent late 2025 consolidating in a massive Re-accumulation Range.
The “Line in the Sand”: $4,450. This is the 2026 “Bull/Bear” pivot. As long as weekly candles close above this, $5,000 is the mathematical target.
Liquidity Void: There is a massive imbalance (FVG) between $4,580 and $4,720. We expect price to “gravitate” toward this zone in Q1 of 2026.
The Intraday Plan (SMC Execution)
For our Telegram members, we look for “Judas Swings” during the London Open.
Stop Hunts: Expect the market to dip below $4,570 to collect retail “Sell Stops” before the real move to $4,650.
Order Blocks: We are currently watching a 4-hour Bullish Order Block at $4,565–$4,580. This is our “High Probability” entry zone.
3. Comparison: Why 2026 is Different from 2025
| Metric | 2025 Reality | 2026 Forecast |
| Price Ceiling | $4,300 | $5,055 (Institutional Target) |
| Primary Driver | Interest Rate Hype | Structural Reserve Shifts |
| Retail Sentiment | Fear of Heights | Fear of Missing Out (FOMO) |
| Volatility | Moderate | High (Sharp Reversals) |
4. Expert Insight: How to Manage Risk in a Parabolic Market
“In a parabolic market like 2026, the biggest risk isn’t the price dropping—it’s getting ‘shaken out’ by institutional stop-hunts. We recommend using a minimum 1:3 Risk-to-Reward ratio to ensure one win covers three losses.” — Trader RV, Head of Analysis at ForexGoldSignal.
5. Verified Performance: Why Trade With Us?
We link our performance directly to Myfxbook.
Average Accuracy: 82% on XAU/USD setups.
Strategy: Pure Price Action and Institutional Liquidity.
Transparency: Every signal comes with a chart breakdown so you learn while you earn.
For a deep dive into how January 2026 specifically played out, read our analysis on Interest Rate Impacts.
[…] Stronger core inflation data and a resilient US labor market, with unemployment holding near 4.4%, forced the Federal Reserve to maintain a hawkish stance. This shift in expectations played a major role in shaping the gold price in January 2026. […]